Performance Benchmark Report Generator
A Python toolchain that ingests daily CSV exports from Unreal Engine capture-point benchmarks and outputs a single self-contained HTML report. No server, no database, no dependencies beyond the Python standard library.
Real benchmark data with anonymised capture point names — all tabs and charts are fully interactive.
Preview
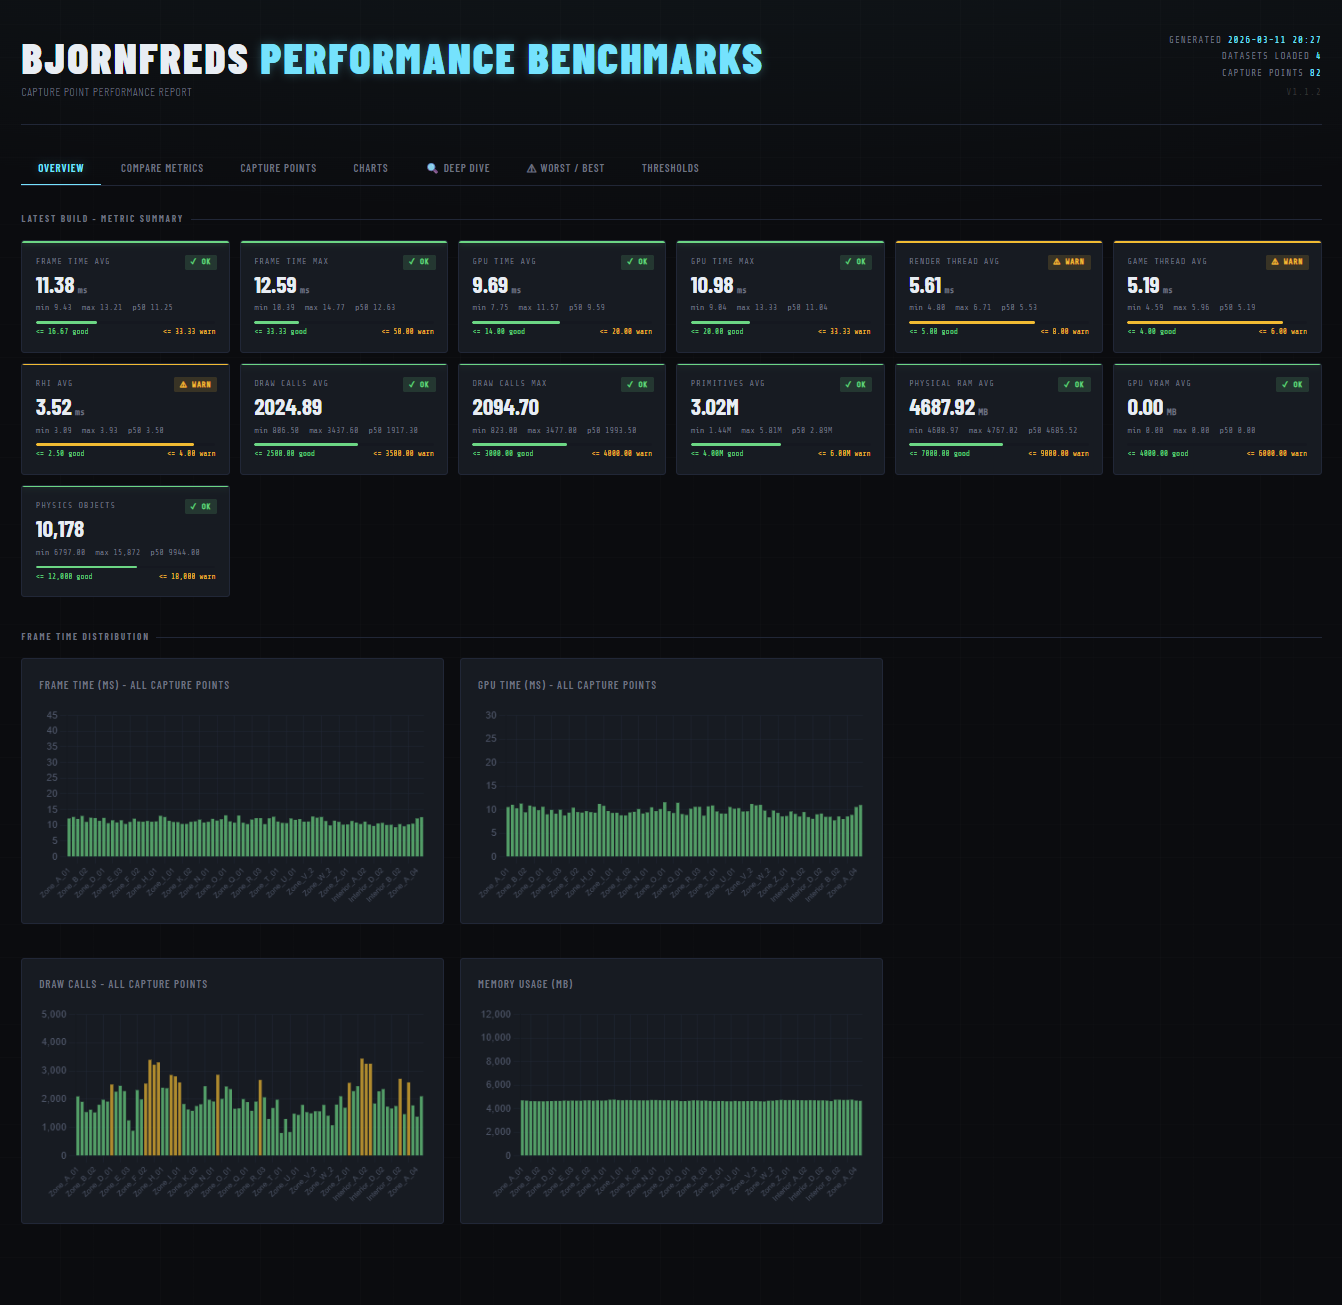
Summary cards and trend charts on the Overview tab — each metric graded against configurable thresholds
The Problem
Every nightly CI run produces one CSV per map with frame time, GPU time, draw calls, memory, and physics counts for every capture point. Tracking regressions across builds meant manually diffing spreadsheets. The goal was a zero-friction pipeline anyone on the team could run without installing anything extra.
Pipeline
Three scripts, one output file.
download_benchmarks.py   ← crawls the build server, saves dated CSVs locally
        │
        ▼
  csvs/capture_point_data_YYYY-MM-DD.csv   (one per build day)
        │
        ▼
bench.py                 ← parses, aggregates, renders
        │
        ▼
  report/perf_report.html  ← self-contained, no server needed
run_bench.bat wraps both scripts so anyone can regenerate
the report with a double-click — no terminal needed.
CSV Parsing
Unreal's CSV exports can come out as UTF-8-BOM, UTF-8, or latin-1 depending on the machine. The parser tries all three in sequence rather than crashing on an unexpected encoding.
def parse_csv(path: Path) -> list:
    for encoding in ("utf-8-sig", "utf-8", "latin-1"):
        try:
            with open(path, newline="", encoding=encoding) as f:
                ...
            return rows  # success — stop trying
        except UnicodeDecodeError:
            continue     # try next encoding
Numeric fields are coerced to float; anything that fails
is kept as a string. Blank trailing rows common in Unreal exports are
dropped by checking the Capture Point key is non-empty.
Threshold System
All performance targets live in one list of tuples at the top of the script. Change a number there and every badge, bar, and table cell in the report updates automatically.
THRESHOLDS = [
    # key               display name          unit   good    warn    lower_is_better
    ("FrameAvg",        "Frame Time Avg",     "ms",  16.67,  33.33,  True),
    ("GpuAvg",          "GPU Time Avg",       "ms",  14.00,  20.00,  True),
    ("GameAvg",         "Game Thread Avg",    "ms",   4.00,   6.00,  True),
    ("DrawCallsAvg",    "Draw Calls Avg",     "",  2500.0, 3500.0,   True),
    ("PrimitivesAvg",   "Primitives Avg",     "",  4e6,    6e6,      True),
    # ...
]
The grade() function returns "good",
"warn", or "bad" — used directly as a CSS
class, so there's no separate rendering logic to maintain.
Self-Contained Report
All parsed data is serialised to a single JSON object and injected
into the HTML template as a const DATA = {...} assignment.
The file needs no server or build step to open — just a browser.
The report has six tabs, all reading from that one DATA object:
- Overview — summary cards with pass/warn/fail grading and trend charts across all builds.
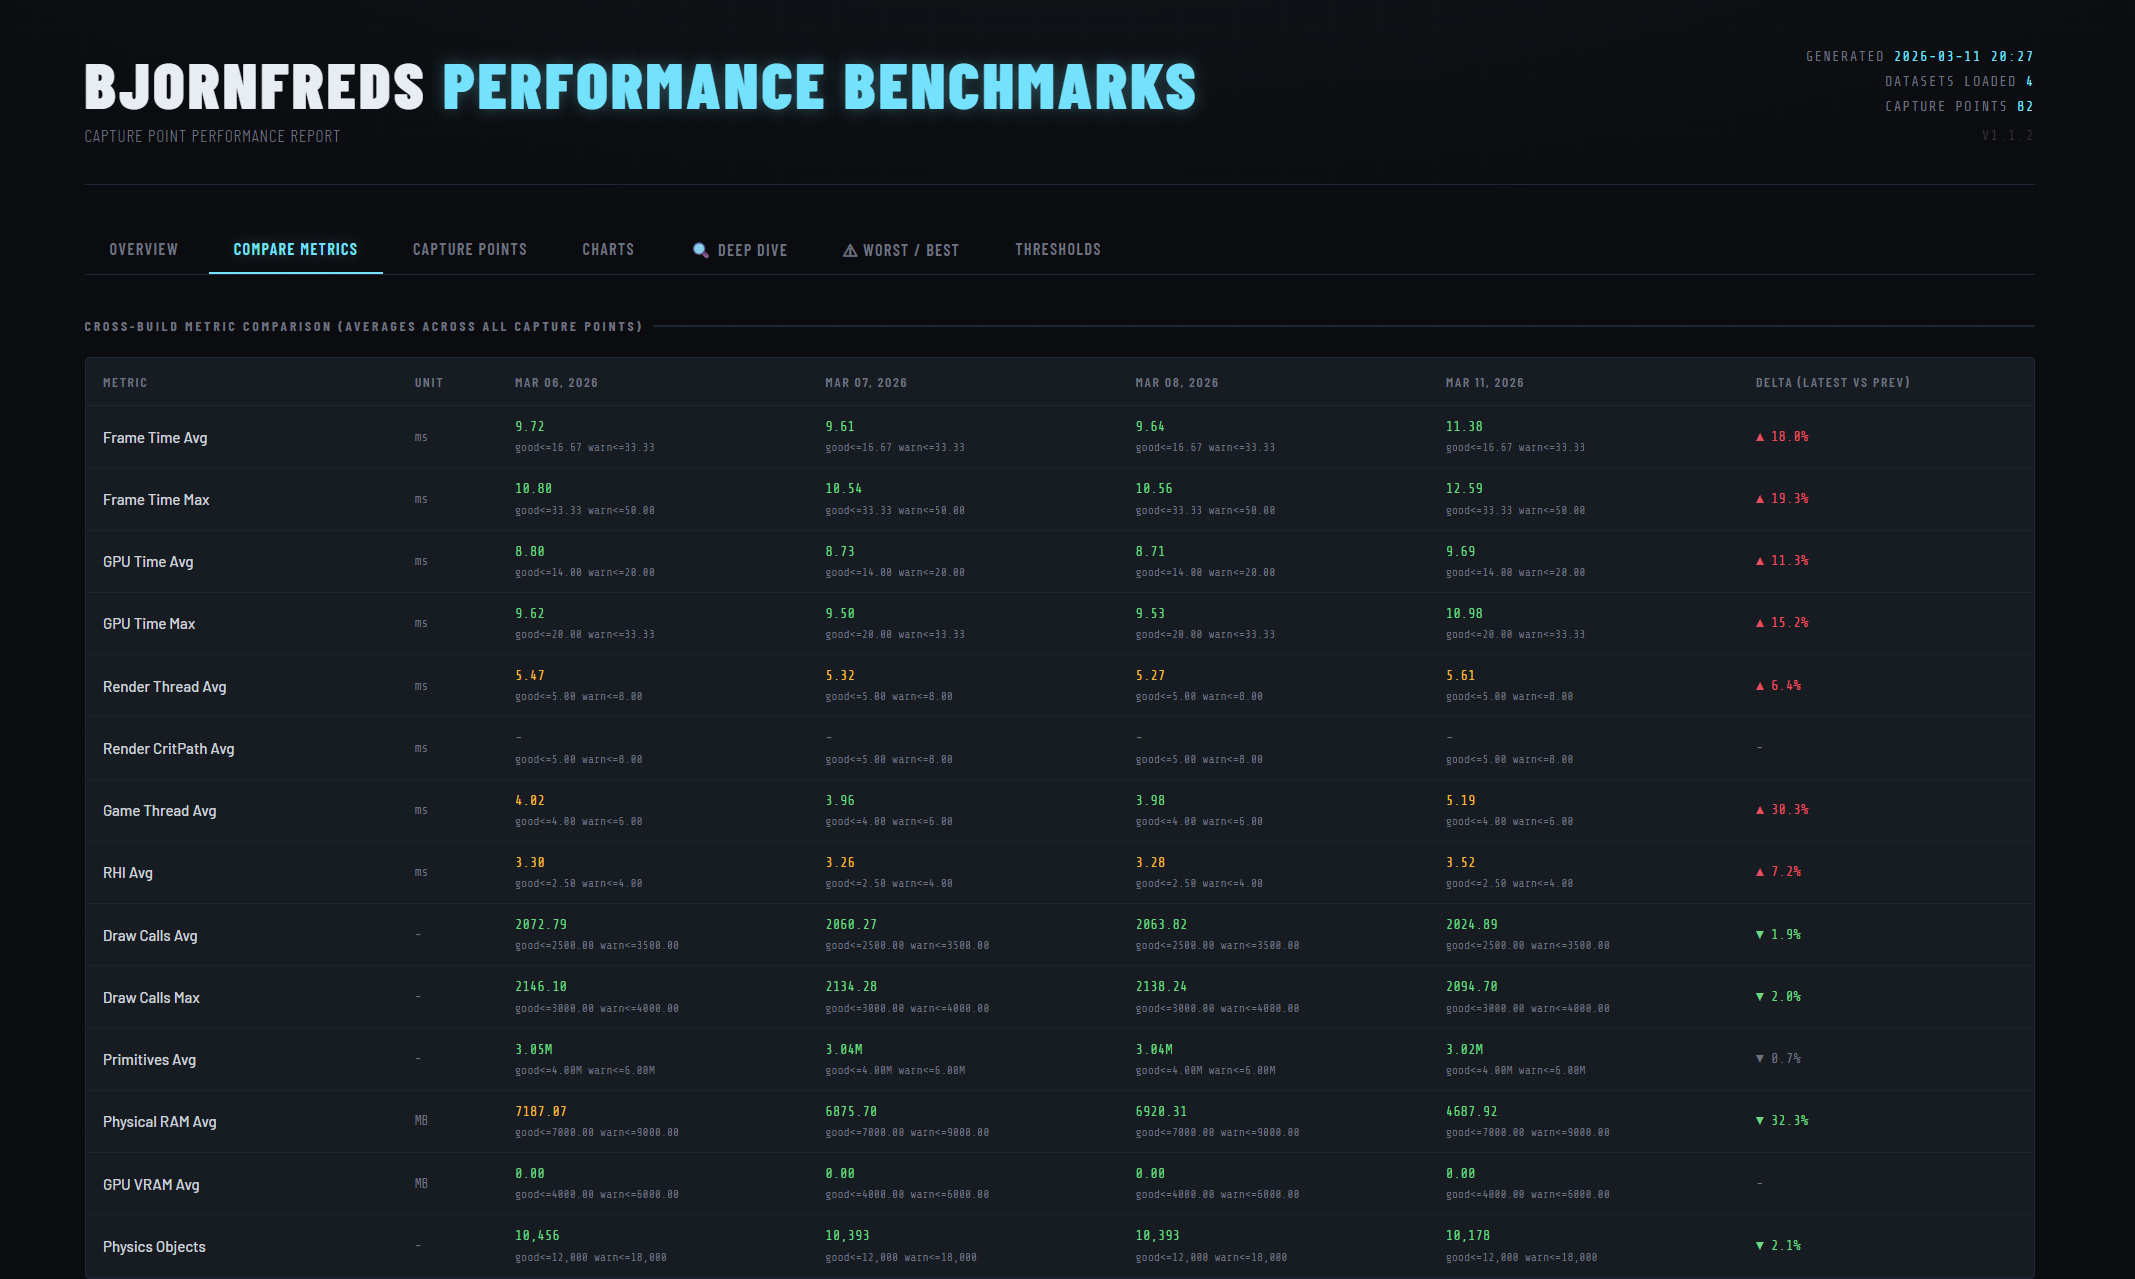
- Comparison — cross-build table with delta % per metric and a total delta from baseline.
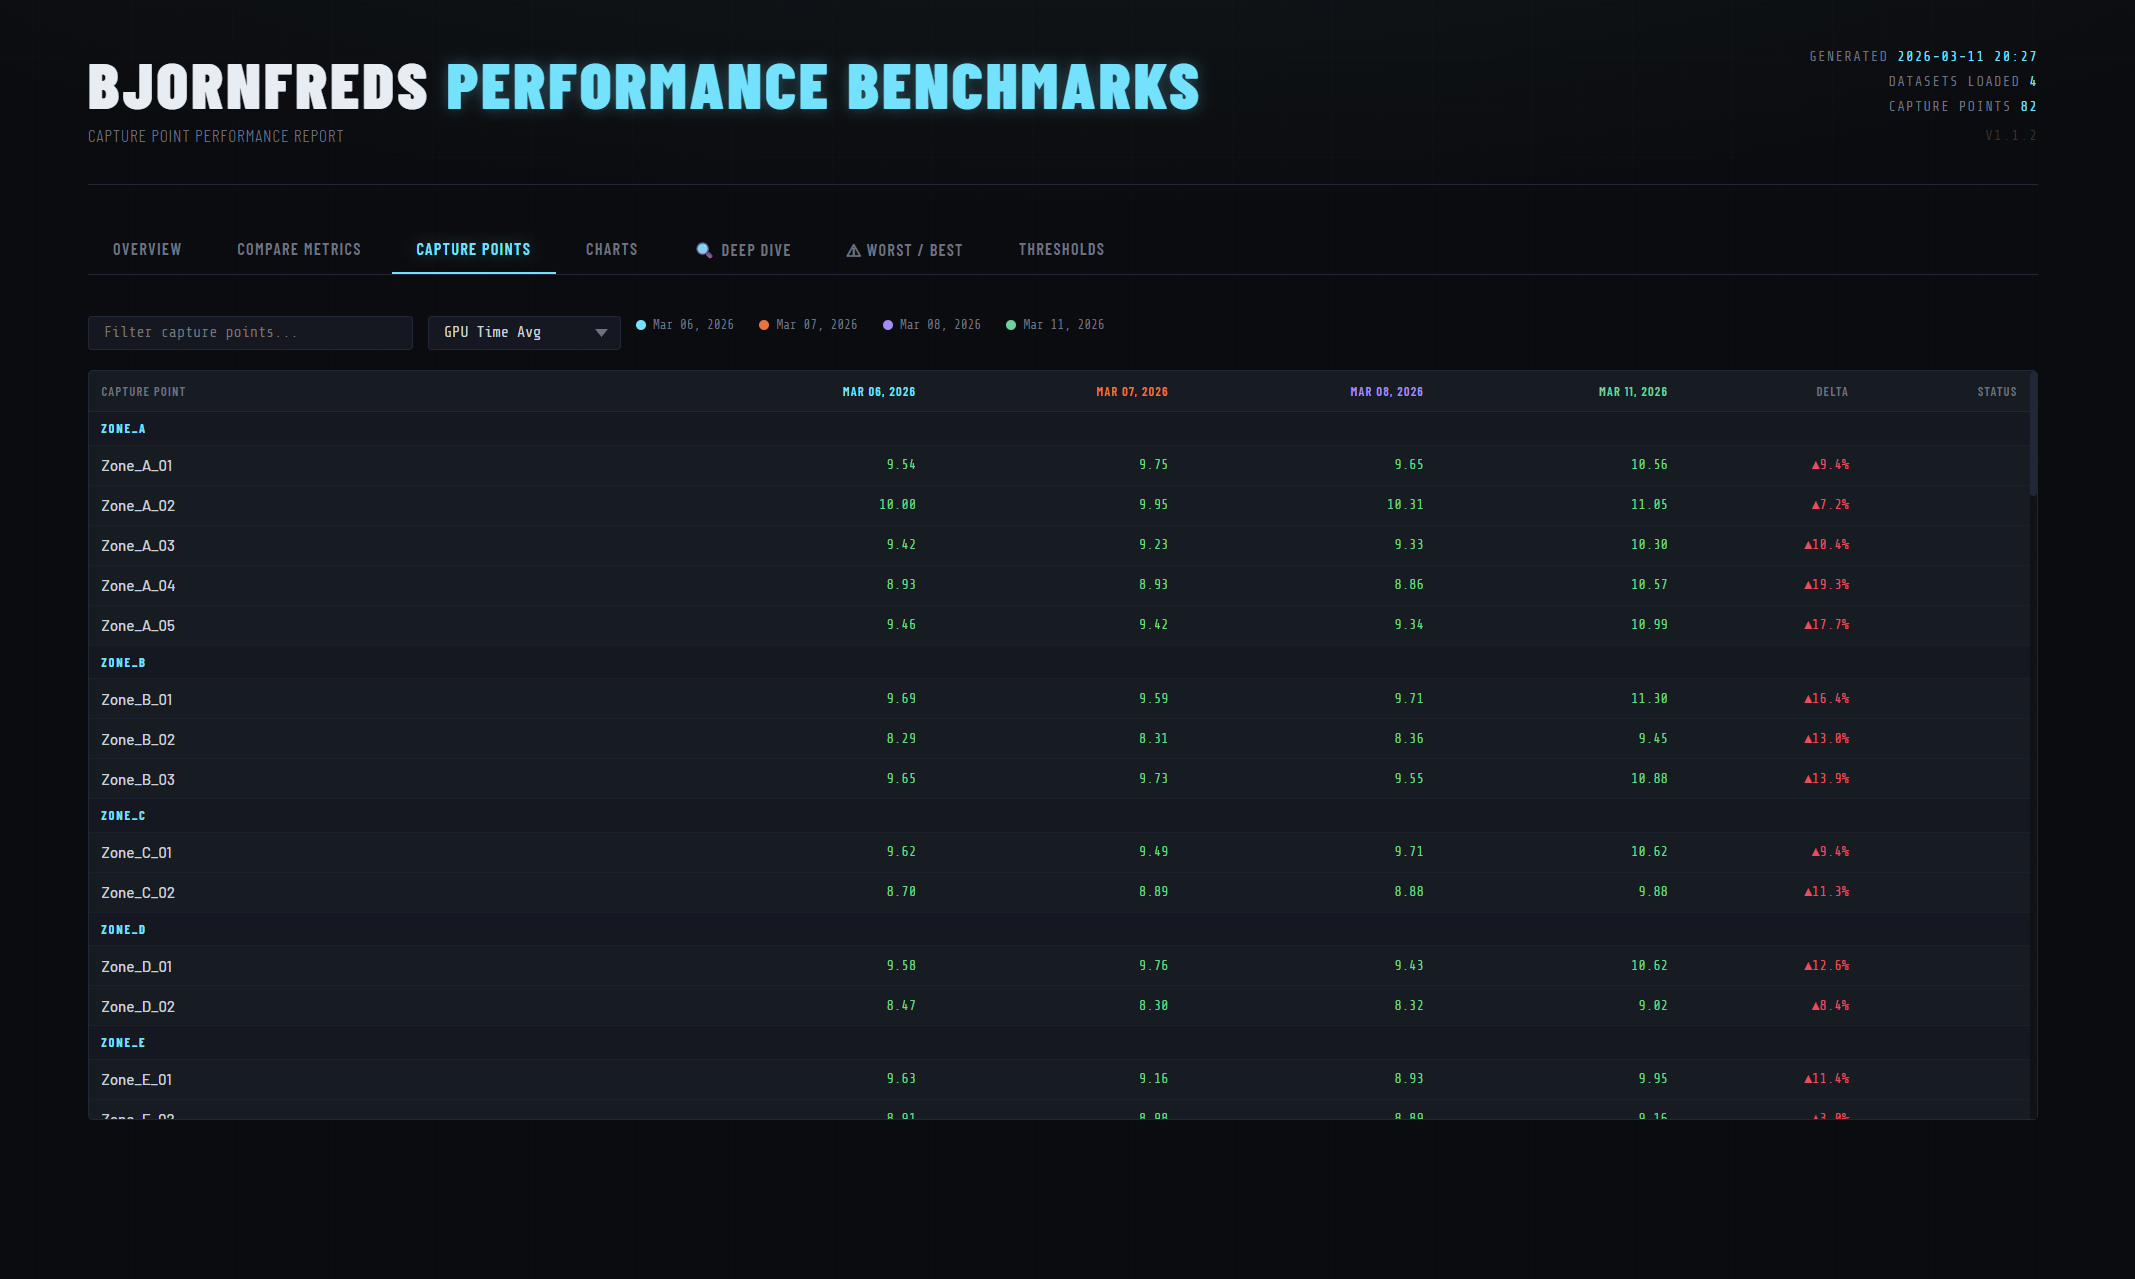
- Capture Points — live-searchable, filterable per-capture-point table.
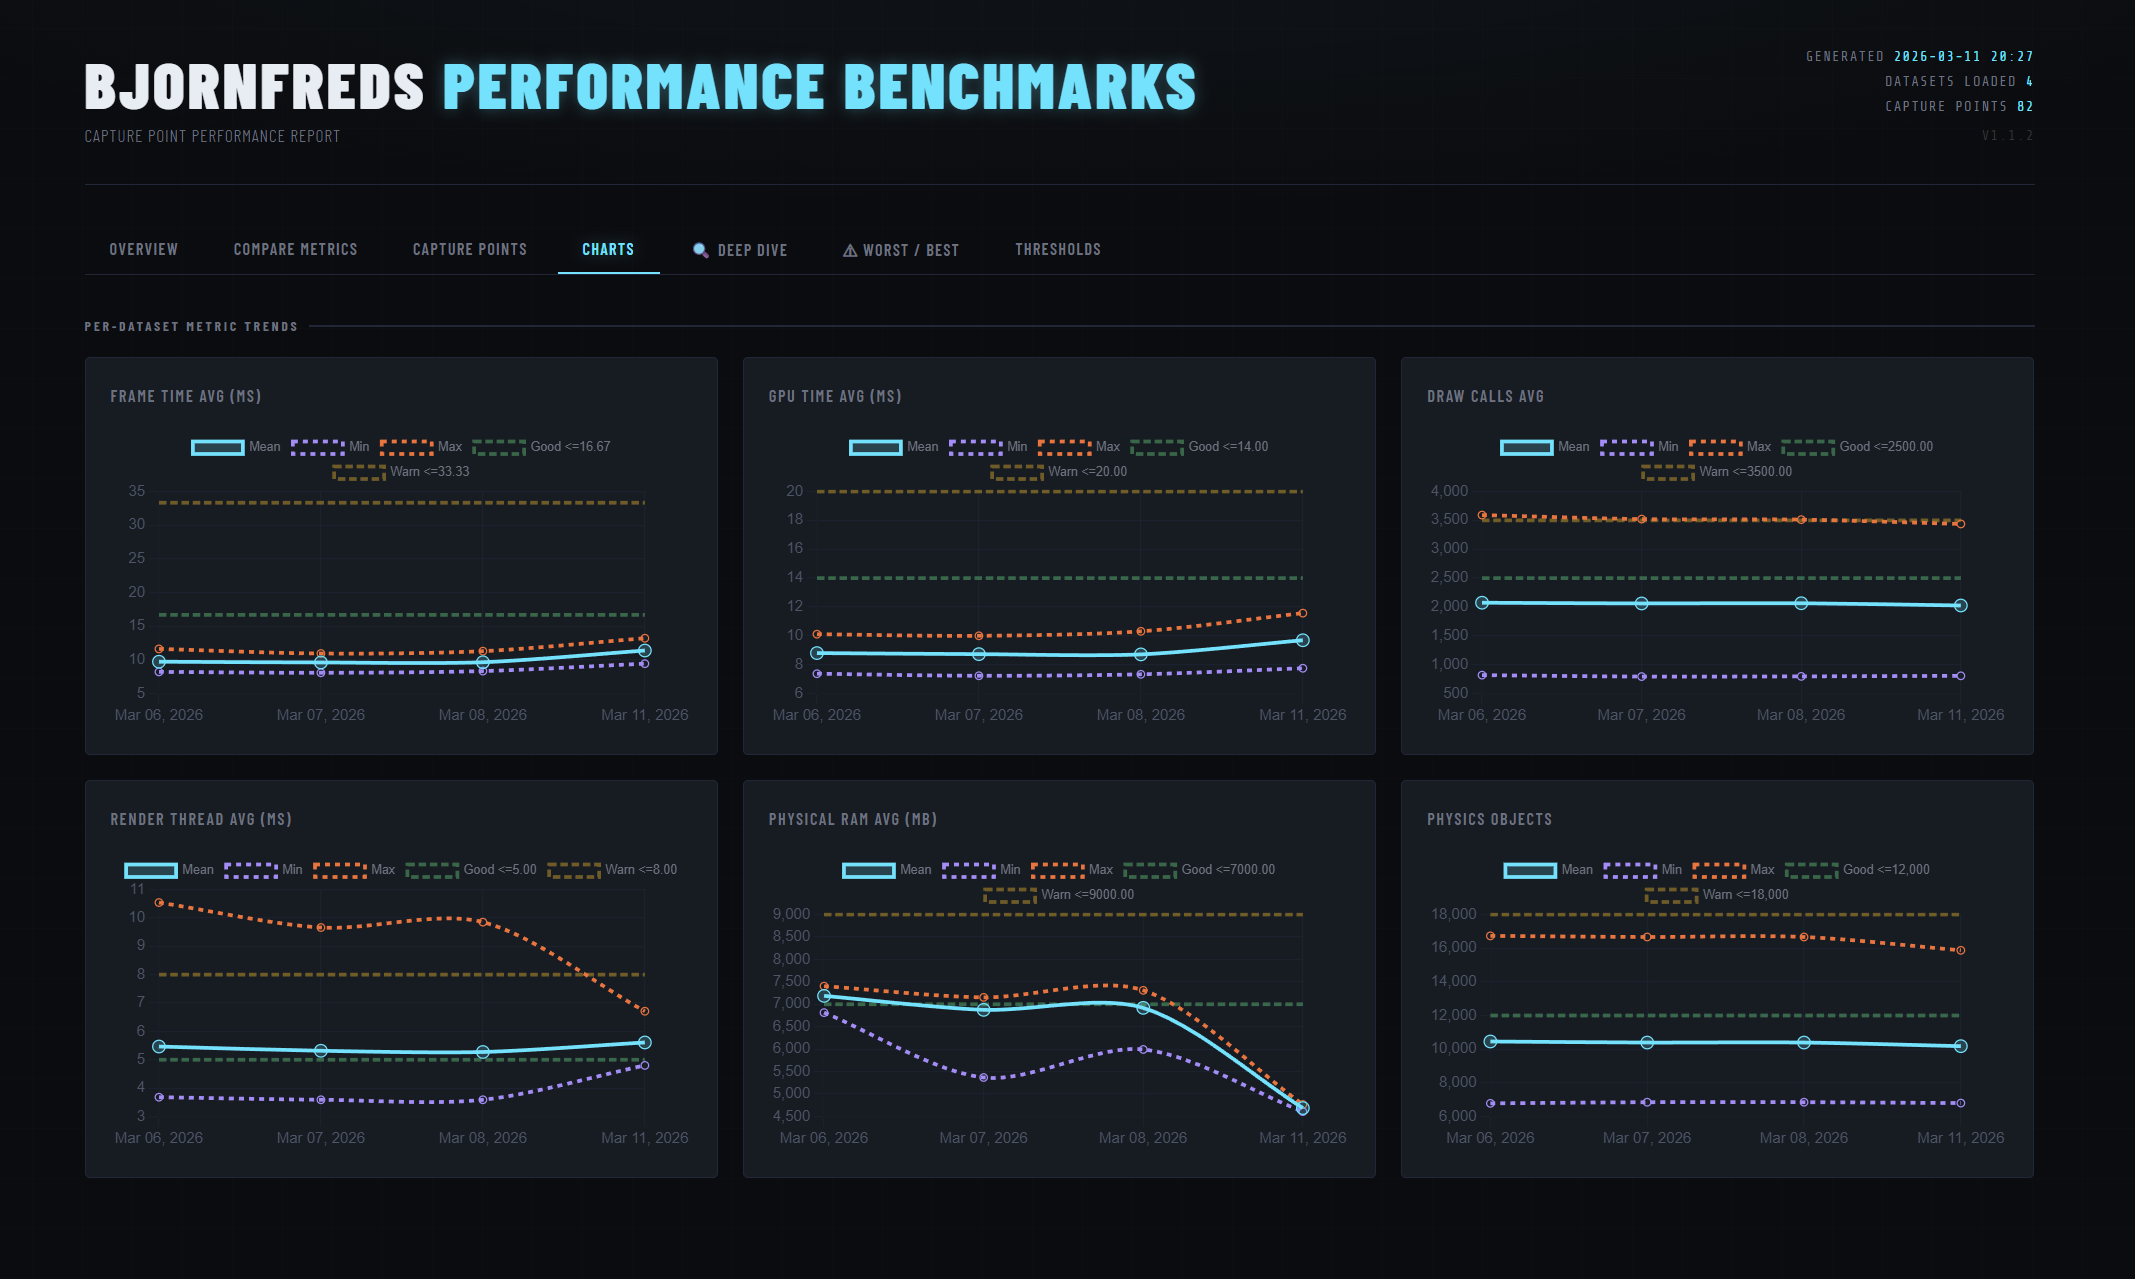
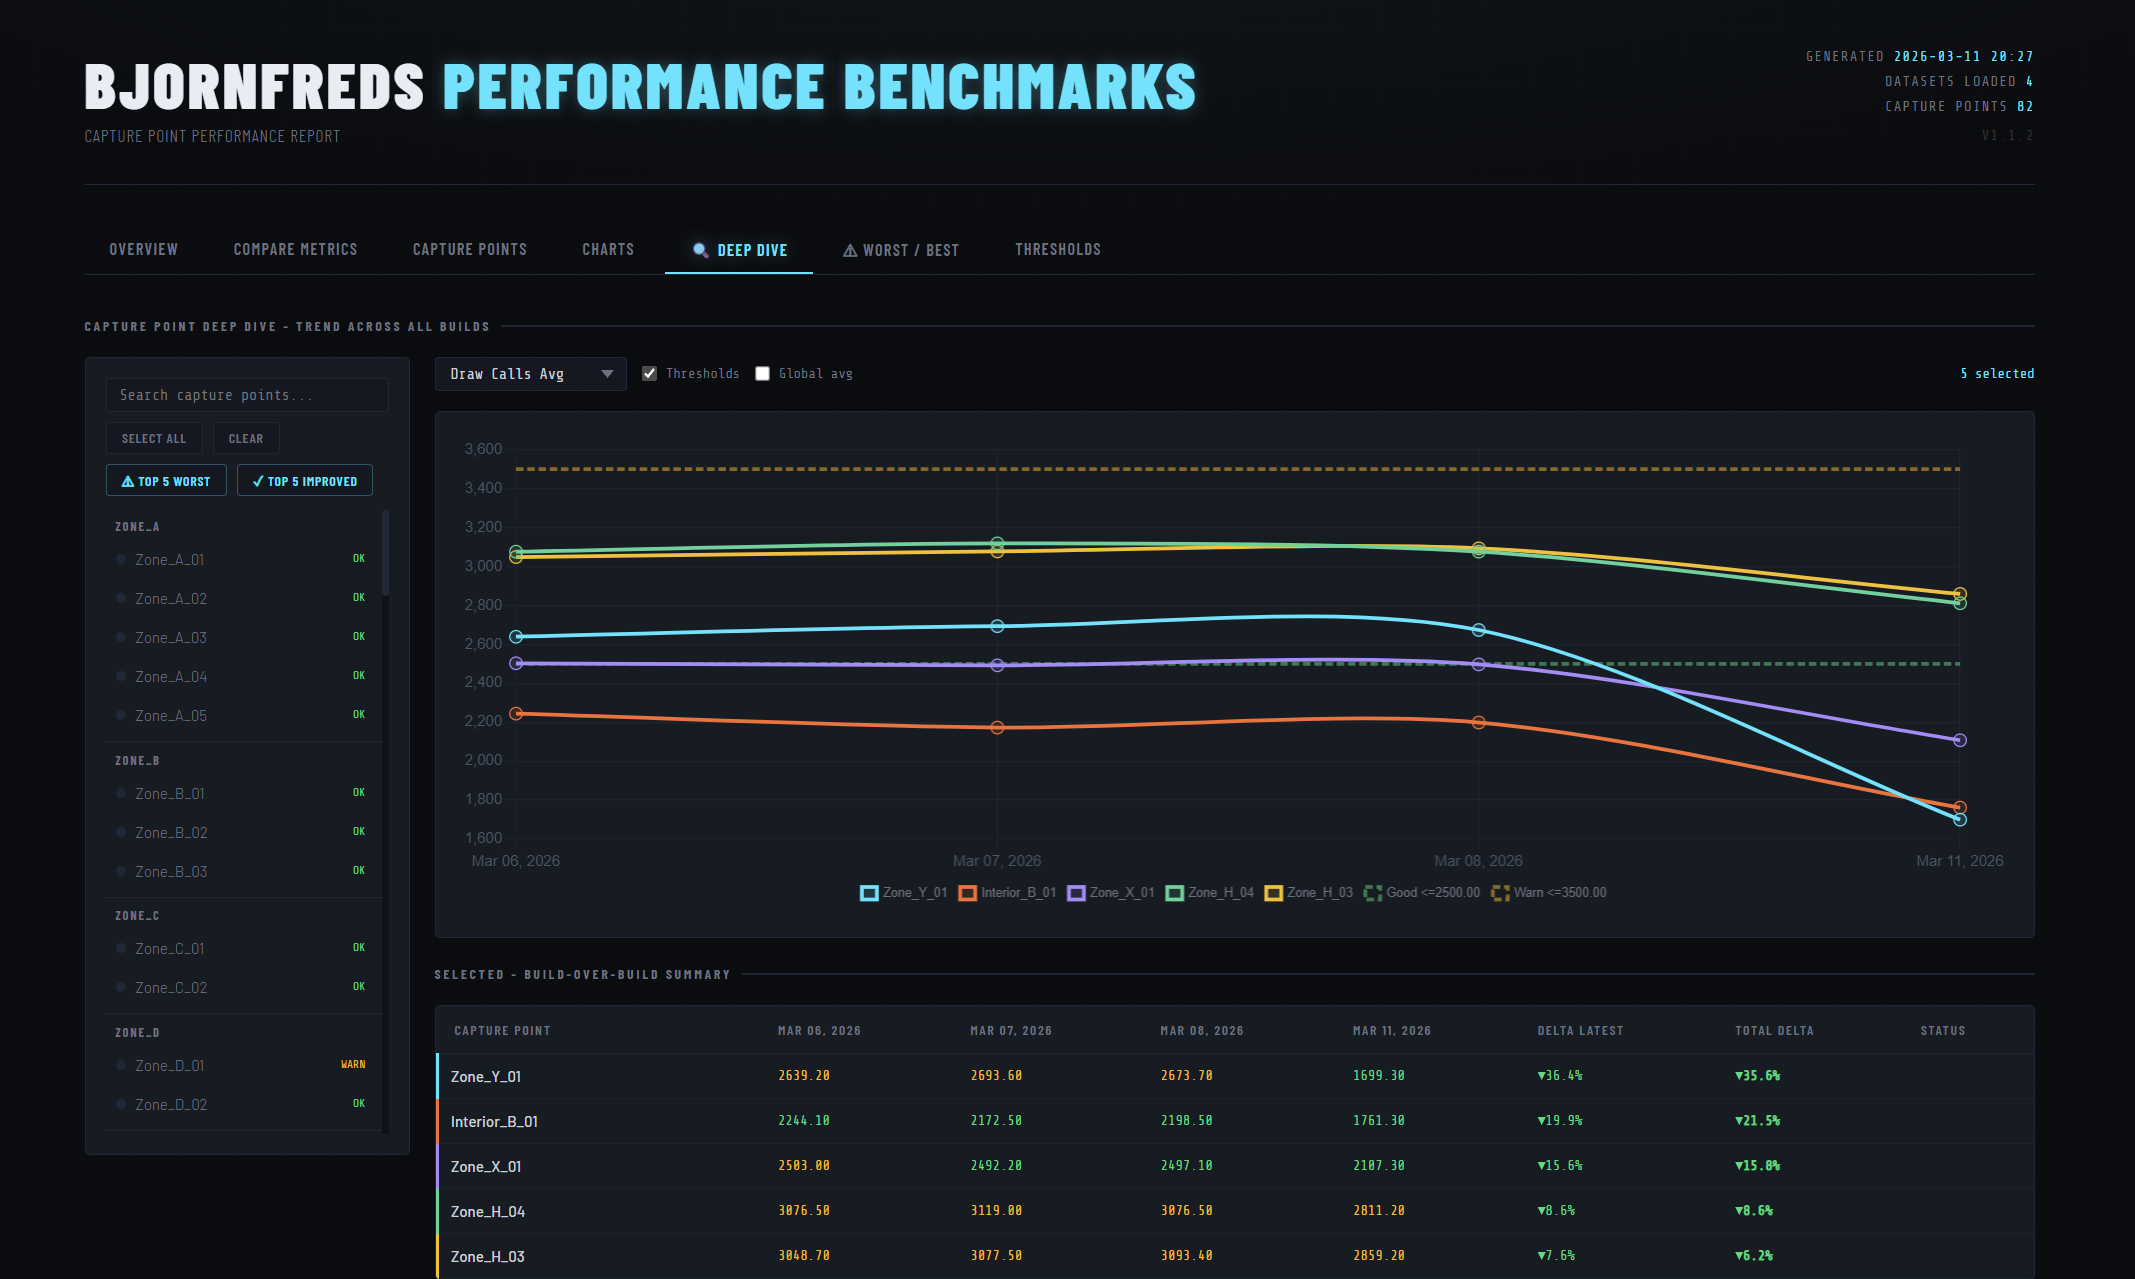
- Deep Dive — multi-select capture points, compare trends on a shared Chart.js chart with optional threshold overlays.
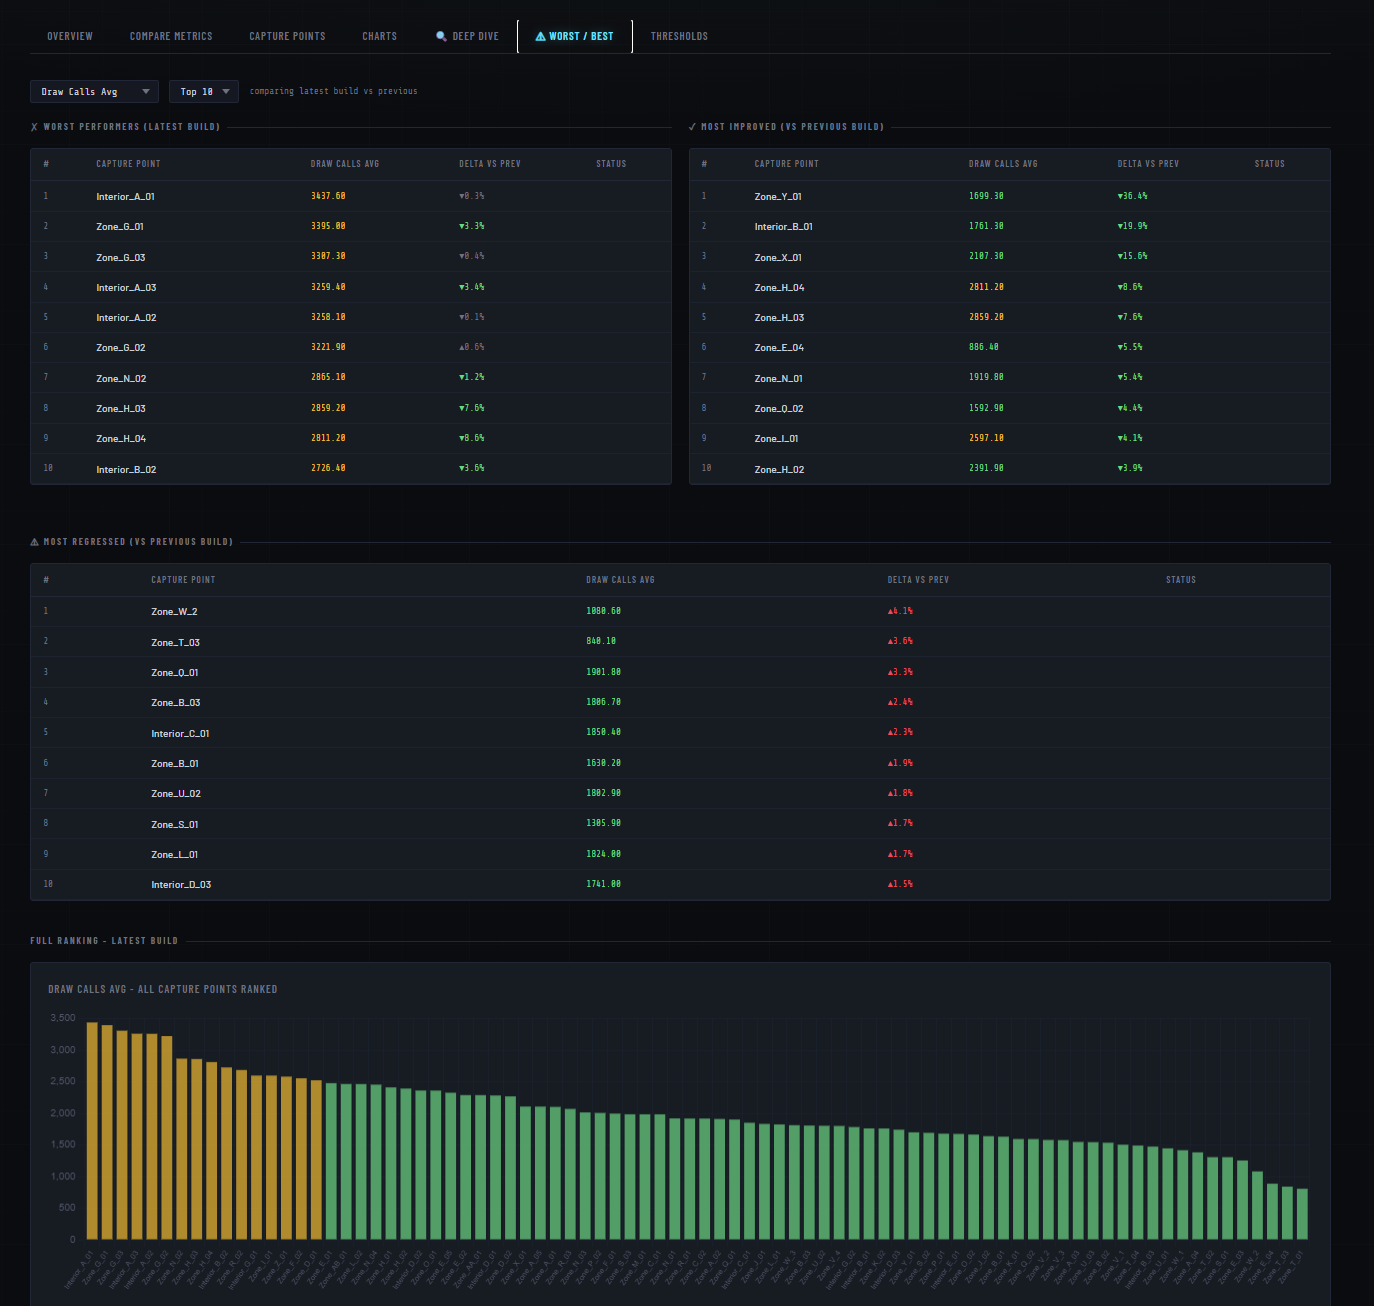
- Worst / Best — ranked tables for worst performers, most improved, and most regressed.
- Thresholds — reference view of all metric limits, rendered from the same data used for grading.
Handling Missing Data
Capture point names are collected into an ordered union across all
datasets. A capture point added mid-sprint is backfilled with
null in earlier builds so trend charts never break when
the level changes between builds.
per_capture[cp] = (
    {m: row.get(m) for m in TABLE_METRICS}
    if row else
    {m: None for m in TABLE_METRICS}  # backfill missing with null
)
Chart.js's spanGaps: true then connects across those
gaps rather than leaving holes in the line.